Multi-Tower Observations Improve Understanding of Wind regimes and Carbon Fluxes in Mountainous Forests
Research group from the Institute of Applied Ecology, Chinese Academy of Sciences (CAS),led by Academician ZHU Jiaojun, have reported a series of findings that advance understanding of wind regimes in mountainous forest ecosystems and their implications for carbon flux measurements. Based on long-term observations from eddy covariance (EC) flux towers (the Qingyuan-Ker Towers, composed of three 50-m flux towers, Fig. 1) within a 536-ha temperate forest watershed, these studies address long-standing methodological challenges associated with applying the EC technique in complex terrain. The results were published in Chinese Journal of Applied Ecology, Agricultural and Forest Meteorology, and Science China Earth Sciences.
The EC method is the only approach that can directly measure exchanges of carbon dioxide, water vapor, and energy between ecosystems and the atmosphere. While the technique has been extensively and successfully applied in flat terrain, its application in mountainous forest regions is still subject to substantial uncertainty. In complex terrain, highly heterogeneous wind fields driven by topography and thermal processes complicate data interpretation and quality control. As a result, measurements from a single flux tower often fail to adequately represent the spatial structure of airflow in mountainous forests.
To address these limitations, the CAS research team conducted a series of investigations at the Qingyuan-Ker Towers, a forested watershed covering approximately 536.4 ha which includes three observation towers. Each tower is located in a distinct forest type—a natural deciduous mixed forest, a natural Mongolian oak forest, and a larch plantation—providing a unique opportunity to examine wind regimes and carbon flux dynamics across contrasting forest ecosystems within the same mountainous watershed.
In the first study, the researchers evaluated the applicability of widely used wind speed profile models in mountainous forest. These models, largely derived from Monin–Obukhov similarity theory, are commonly employed in flat terrain and are critical for estimating aerodynamic parameters required for EC-based flux calculations. The results showed that these generalized performed poorly at all three forest towers in Qingyuan, exhibiting low explanatory power and large inaccuracies, while they worked well at a cropland site located in the flat Panjin Plain (Fig. 2). The discrepancies were primarily attributed to topographic influences, with seasonal differences between leaf-on and leaf-off periods also contributing. Key aerodynamic parameters, including zero-plane displacement height and surface roughness length, were systematically underestimated in complex terrain, resulting in inaccurate estimates of aerodynamic height. The findings, published in Chinese Journal of Applied Ecology, provide guidance for improving parameter calibration in EC studies conducted in mountainous regions.
In a second study, published in Agricultural and Forest Meteorology, the team used data from the three towers to characterize wind regimes and their driving forces. The results indicated that thermally driven mountain–valley wind systems were strongly modulated by regional weather conditions. During daytime, downslope winds dominated above the canopy at two towers, while upslope winds prevailed at the third. At night, each site showed a distinct dominant flow regime. Pronounced vertical wind direction shear was frequently observed, suggesting a decoupling between airflow above the canopy and within the canopy layer. Classical diurnal reversals of mountain–valley winds occurred on only about 10% of days, reflecting the combined influence of synoptic-scale winds and local thermal circulations, which weakened the idealized pattern (Fig. 3). Further analysis showed that nighttime drainage flows were more frequent at the larch plantation site, potentially leading to an underestimation of net ecosystem CO2 exchange, while such effects were weaker at the other two towers. These findings provide a scientific basis for improving nighttime flux correction in mountainous forest ecosystems.
Building on these insights, the researchers further proposed an improved strategy for processing and gap-filling eddy covariance CO₂ flux data in complex terrain. Given the strong directional heterogeneity of surrounding CO₂ source and sink distributions, conventional data processing approaches often introduce substantial bias. By dividing wind directions into discrete sectors and estimating friction velocity thresholds separately for each sector, the accuracy of nighttime flux filtering was markedly improved. This sector-based approach significantly reduced bias in the final flux estimates. Among several gap-filling methods evaluated, random forest models demonstrated the highest accuracy and robustness, especially for annual net ecosystem exchange estimates (Fig. 4). This work, published in Science China Earth Sciences, highlights the critical importance of adopting terrain-sensitive data processing strategies when assessing forest carbon sinks at regional and global scales.
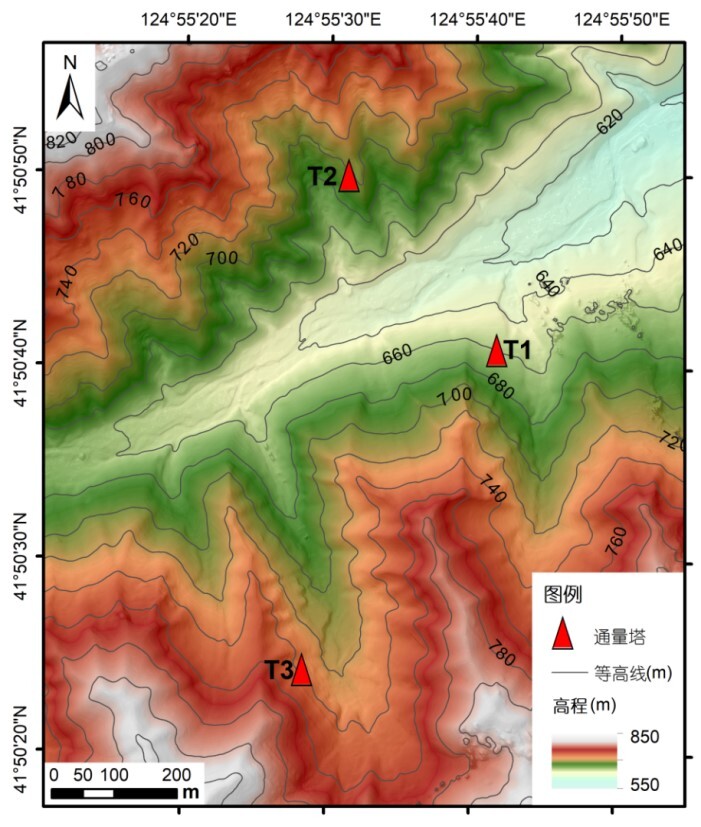
Fig. 1 A top view of Qingyuan-Ker Towers in the elevation contour map of the watershed (Image by GAO Tian).
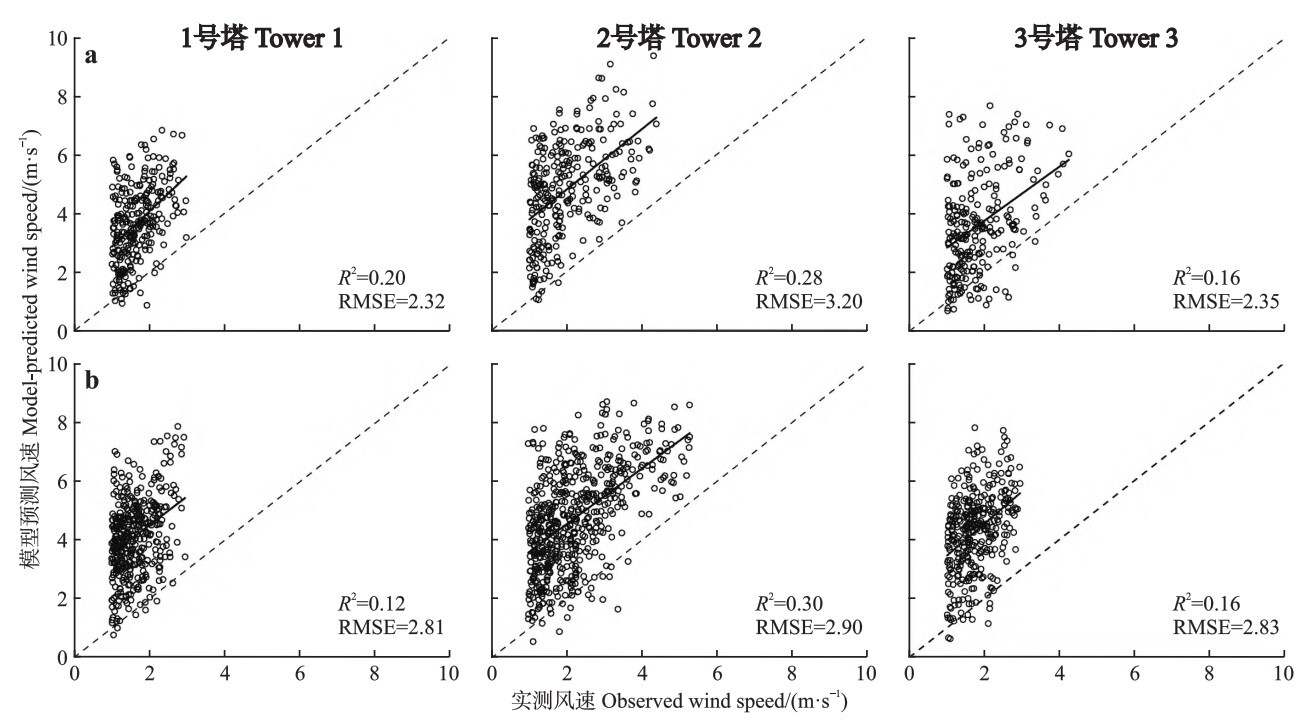
Fig. 2 Correlation of measured and predicted wind speed over the forest (Image by GAO Tian).
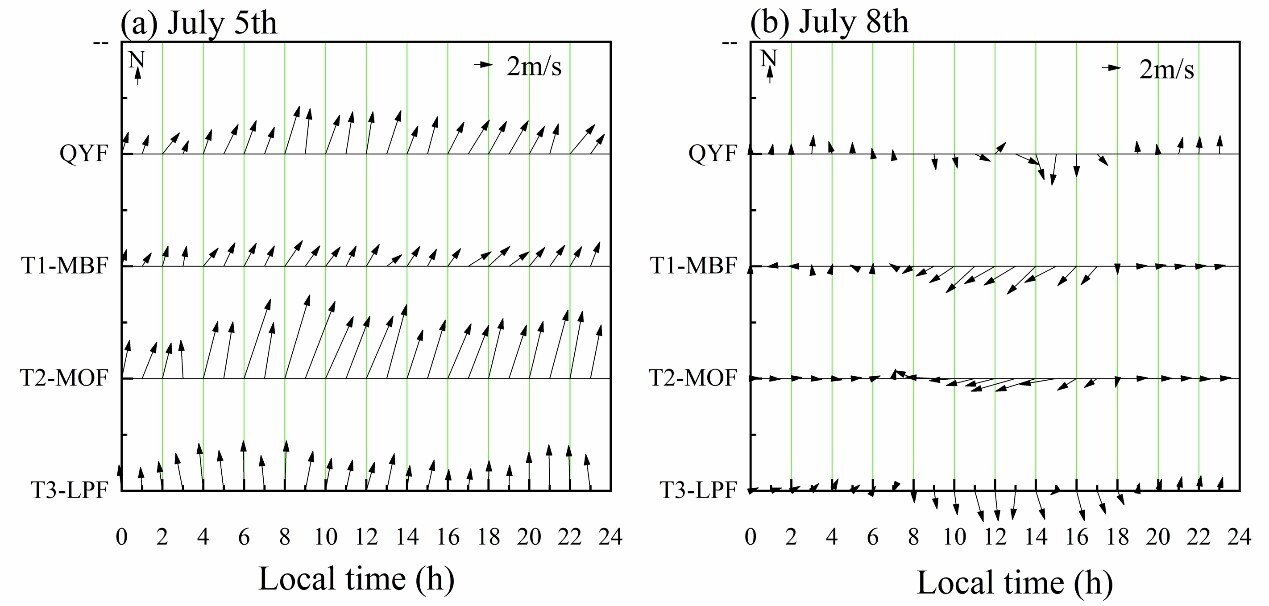
Fig. 3 A case analysis of a day affected by background airflow (clearness index (Kt): 0.28) (a) and a day with typical valley wind circulation (Kt: 0.62) (b). T1-MBF (mixed broadleaved forest), T2-MOF (Mongolian oak forest), T3-LPF (larch plantation forest) (Image by GAO Tian).
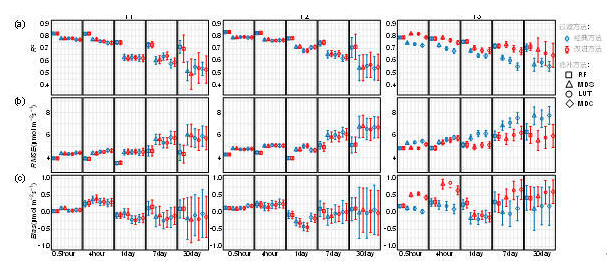
Fig. 4 The performance metric of gap-filling methods is related to the gap length. Coefficient of determination (a), root mean square error (b), and bias (c) under different gap lengths, data filtering, and gap-filling methods. RF, random forest; MDS, marginal distribution sampling; LUT, look-up table; MDC, mean diurnal course. Symbols represent the mean values of those metric values from 100 sets of tests while an error bar denotes a standard deviation (Image by GAO Tian).
